technology

REFAMO'S

SERVICE PATH

Refamo's service path consists of four stages. Depending on the project, turn-key solutions are provided, i.e. all stages are performed by Refamo. Alternatively, the client might have FEM models, intercoms or installation resources that can be utilized.

REQUIREMENTS


FInite element analysis


The to-be-monitored hot spots of the welded steel structure are identified through Finite Element Analysis.

LOAD HISTORY


In retrofit cases, information about the load history is beneficial for the determination of the current fatigue level. 

AGE OF DETAILS


The age of the construction details needs to be known in order to determine the starting fatigue level.

'

connected data


GPS, acceleration, weather, etc. data can be coupled with the fatigue data.

installation


01

strain gauges

Strain gauges are installed on the hot spots

02

amplifiers

The strain gauge amplifiers are installed

03

pc

The industrial PC is installed

04

protection

The strain gauges and their cabling must be protected properly

01

strain gauges

Strain gauges are installed on the hot spots

02

amplifiers

The strain gauge amplifiers are installed

03

pc

The industrial PC is installed

04

protection

The strain gauges and their cabling must be protected properly

Analysis


4r Algorithm

The core of our technology is our algorithm that converts measured real loads data into fatigue data according to the 4R methodology. The computing is done locally on the asset. Depending on the use case, either just the change in the Fatigue Index or a combination of Fatigue Index and the raw loads data are sent to the cloud.

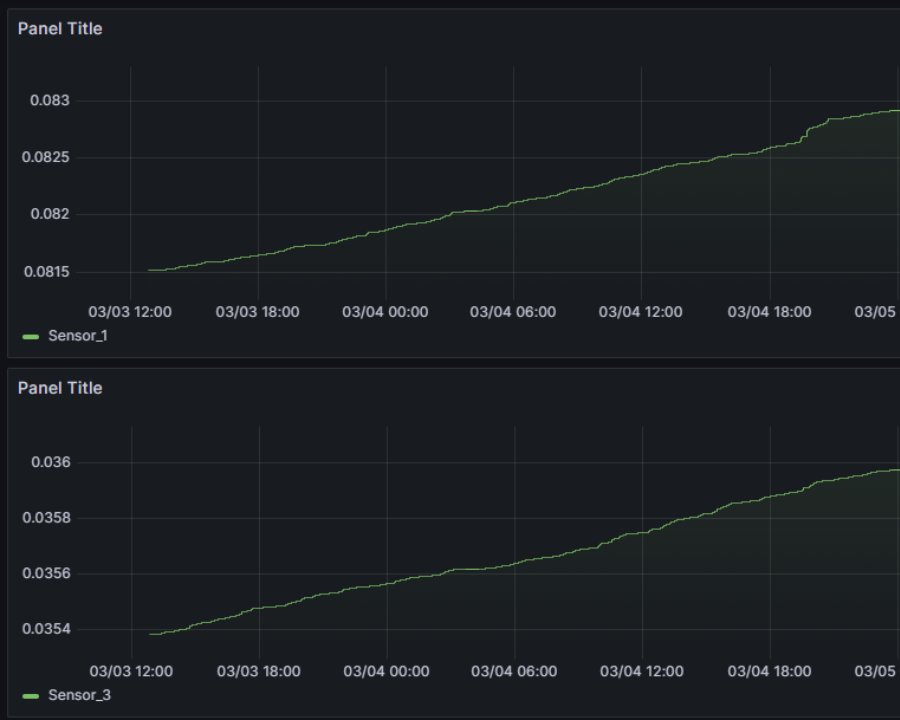
Reporting & visualization


Fatigue data visualization

At the reporting and visualization stage, the changes in the fatigue levels are visualized at the user interfaces of different user groups. Depending on the use case, this visualization manifests in the operator's UI or a separate UI and is performed in real-time or at defined intervals. In the real-time use case the information can be displayed on the asset's intercom.

GPS, ACCELERATION, WEATHER

GPS, ACCELERATION, WEATHER

Depending on the connected data (GPS, acceleration, weather, etc.), the visualizations might now reveal correlations between the operation of the asset, external conditions and the rate of fatiguing.

Depending on the connected data (GPS, acceleration, weather, etc.), the visualizations might now reveal correlations between the operation of the asset, external conditions and the rate of fatiguing.

BENEFITS

Now that you know the service path, let's explore the benefits of Refamo's technology →

Share by: